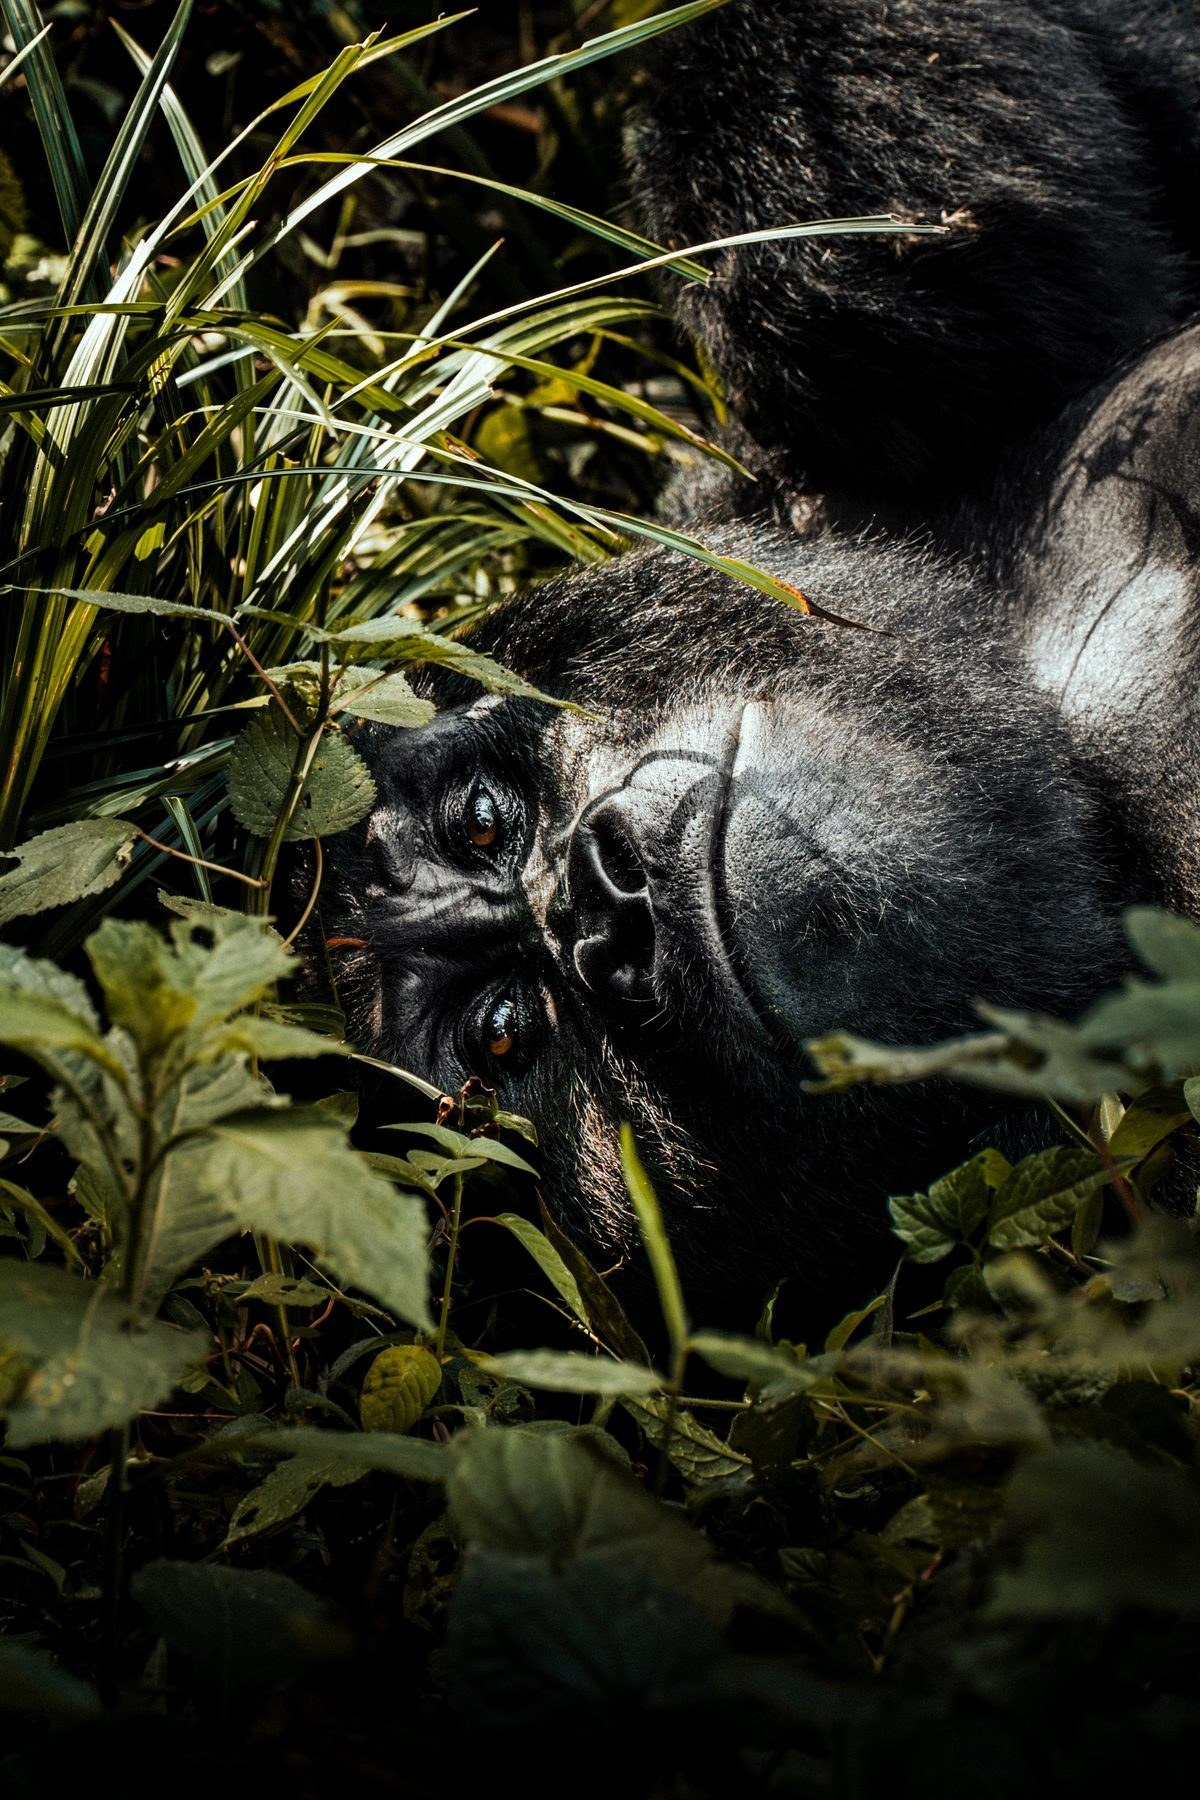
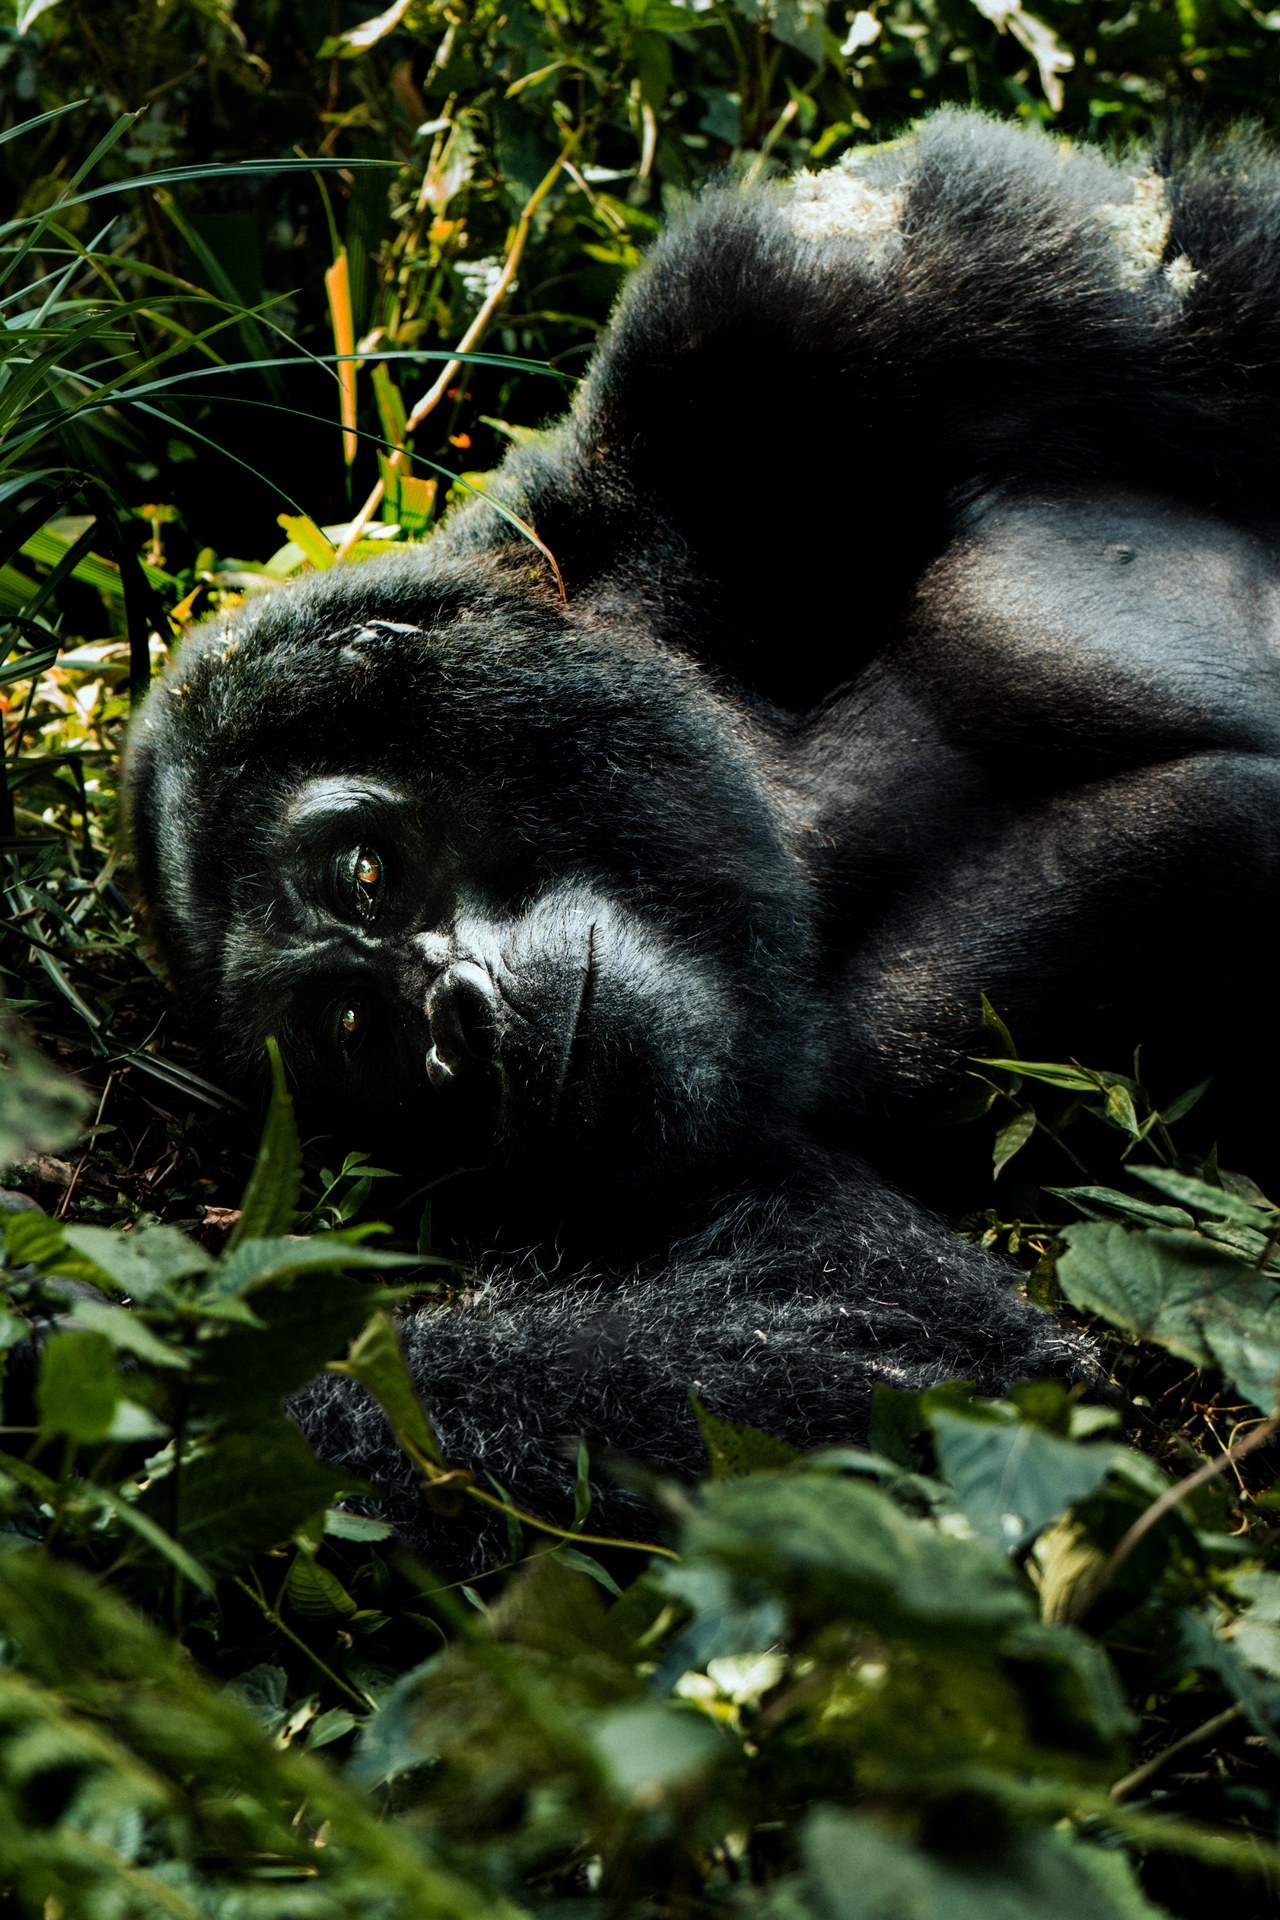
After three hours of moving through dense forest on a gorilla trek in Bwindi Impenetrable National Park, our group reached a family resting on a slope thick with undergrowth. They were entirely calm. We crouched in the vegetation a few metres away and watched — the silverback shifting weight, a juvenile pulling at a branch overhead, an adult female moving through the group with the unhurried deliberateness of an animal that has learned, over years of habituation, that the small cluster of humans is not worth attending to. During my visit in June 2026, standing at GPS coordinates –0.9735°N, 29.6281°E, the forest felt genuinely impenetrable from the inside: vertical, layered, wet, and extraordinarily alive.
That encounter is the outcome that conservation metrics exist to protect. Behind it lies a network of population surveys, vegetation indices, corridor assessments, and human-wildlife conflict records that together tell conservation managers whether the habitat is stable, under pressure, or recovering. The number of gorillas in the forest is the most visible figure — 459 individuals recorded in Uganda during the 2018–2020 census period — but it is only one data point in a far more complex assessment. Understanding what the other metrics measure, and why they matter, is essential to understanding how Bwindi's gorilla population has managed to grow while the forests around most of Africa's great apes have contracted.
This article draws on documented visits to Bwindi across October 2024, January 2026, and June 2026, as well as the conservation literature that frames how habitat quality is defined and measured for mountain gorillas specifically. It covers the principal metrics in use, the population data those metrics have generated, the physical and ecological indicators scientists track beyond the census itself, and the landscape-scale pressures that present-day monitoring is designed to detect before they translate into population decline.
The Population Metric: What Census Data Actually Tells Us
The most frequently cited conservation figure for mountain gorillas is the global population count. When that count crossed the threshold of 1,000 individuals — combining the Bwindi population with the Virunga population spread across Rwanda, the Democratic Republic of Congo, and Uganda's Mgahinga Gorilla National Park — it was widely reported as a conservation milestone. The mountain gorilla became the only great ape subspecies whose wild population had grown during a period when most primate species were in decline.
The Uganda-specific figure, derived from the census conducted between 2018 and 2020, recorded 459 gorillas within the country. Bwindi accounts for the great majority of these. Population trend monitoring in Bwindi Impenetrable National Park has been conducted continuously since 2011, allowing researchers to track not just total numbers but age class distribution — the ratio of infants, juveniles, adults, and silverbacks — which provides an indication of reproductive success and generational replacement rates.
A census figure alone, however, does not indicate whether the population is at carrying capacity, below it, or in a trajectory that could reverse. It does not tell managers how food availability changes across seasons, whether specific family groups are experiencing elevated stress, or whether the habitat supporting a numerically stable population is itself stable. Population count data is therefore the starting point for habitat assessment, not its conclusion.
The Bwindi gorilla population is also genetically distinct from the Virunga group. Separated by a belt of cultivated land that broke the forested corridor between the two ecosystems, the two populations no longer exchange individuals or genetic material. This separation means that a threat to Bwindi's gorillas cannot be offset by the Virunga population, and vice versa. For conservation planning, each population must be managed as an independent unit with its own habitat requirements, demographic dynamics, and risk profile. The metrics applied in Bwindi are therefore calibrated to the specific ecology of this forest, not derived generically from data collected in the volcanoes.
Vegetation and Forage Metrics: What the Forest Provides
Mountain gorillas in Bwindi are predominantly terrestrial browsers, consuming leaves, stems, bark, and fruit from a wide range of plant species. The diversity and availability of these forage plants is a direct indicator of habitat quality — a forest that has lost its understory richness through logging, fire, or invasive species pressure provides structurally similar canopy cover but significantly reduced carrying capacity for gorillas.
Vegetation surveys in Bwindi use permanent plots established at multiple elevations to track changes in plant community composition over time. These plots record the density and distribution of key forage species, the cover of invasive plants that compete with native understory, and the structural complexity of the forest at different vertical layers. Because gorillas use the forest across an altitudinal range from approximately 1,160 metres to over 2,600 metres, monitoring must cover this full gradient. The upper montane zones accessible from the Ruhija sector, which includes the Mubwindi Swamp — a two-square-kilometre wetland in the park's southeast — support different plant communities and different gorilla behaviour than the mid-altitude forests near Buhoma.
The Mubwindi Swamp is particularly significant as a habitat metric reference point because it holds the highest concentration of Albertine Rift endemic bird species in the park and is surrounded by montane forest of exceptional age and structure. Changes in the swamp's hydrology or the condition of adjacent forest are early indicators of broader ecological stress. On the walk to Ruhija during my visit in January 2026, the transitions between vegetation zones were visible over short distances: the mid-altitude forest giving way to bamboo and Afro-montane heath as elevation increased, each zone supporting different forage resources and different gorilla group preferences.
Canopy cover measurements are taken by remote sensing at intervals, allowing managers to detect incursions of forest clearance near or within the park boundary before they become irreversible. Where satellite data indicates anomalies — canopy gaps where none previously existed, for example — ground teams are deployed to investigate. This combination of remote sensing and field verification is the standard approach for large protected areas where continuous foot patrol of every metre of boundary is not feasible.
Corridor Integrity and Landscape-Scale Metrics
A protected area is not an island in an ecological sense, even when it functions as one politically. The forests surrounding Bwindi, and the corridors that once connected it to other large forested blocks in western Uganda, are part of the habitat system that determines the park's long-term carrying capacity. The documented disturbance of elephant and chimpanzee corridors connecting Budongo-Bugoma and Kibale-Bwindi forests through tourism infrastructure development illustrates how connectivity loss outside a park boundary translates into population pressure within it.
For gorillas, the most immediate corridor concern is not long-range dispersal — gorilla groups do not travel between forests the way elephants do — but the integrity of the edge habitat immediately adjacent to the park boundary. Where farmland presses directly against the gazetted boundary without a buffer zone of secondary forest or grassland, gorillas that approach the edge in search of food encounter cultivated crops. This triggers crop raiding, which in turn triggers conflict. Conflict incidents are recorded as a metric, and their distribution along the boundary map indicates which sections of the park edge are under the most pressure.
The UWA's response to this pressure has been both physical and programmatic. In Mgahinga Gorilla National Park, the Authority maintains a 16-kilometre stone wall along sections of the boundary specifically to prevent wildlife from entering agricultural land. The wall is not cosmetic. It generates operational data: the sections that require most repair, the crossing points that animals favour, and the seasonal patterns of boundary pressure all contribute to habitat management decisions. The HuGo programme — Human Gorilla Conflict Intervention and Resolution — operates alongside the wall, deploying trained teams to intercept and redirect gorillas that do move outside the park, and to compensate farmers who have suffered crop losses. Data from HuGo interventions feeds directly into the landscape-scale metrics used to assess how sustainably the gorilla population is co-existing with surrounding communities.
Bwindi itself does not have the equivalent of Mgahinga's stone wall across its entire boundary, but the revenue-sharing mechanism that returns a portion of gate fees and gorilla permit income to surrounding parishes creates an economic incentive for communities to report and resist encroachment rather than participate in it. This mechanism is measurable: permit revenue, community transfers, and local employment figures are all recorded and can be tracked over time. A decline in tourism income, as occurred during the COVID-19 closure, produces a corresponding decline in community transfers and, indirectly, a weakening of the economic case for conservation at the local level. These socioeconomic metrics are therefore considered alongside ecological ones in comprehensive habitat assessments.
Health Monitoring as a Habitat Quality Indicator
The health status of individual gorillas and family groups is both a welfare metric and a habitat quality indicator. A forest that provides adequate food, water, and shelter should produce gorilla populations with stable body condition, low parasite burdens, and normal reproductive rates. Deviations from these baselines — elevated rates of respiratory disease, nutritional stress indicators in infants, or unusual patterns of group fission and fusion — can signal habitat pressure before it shows up in census numbers.
Veterinary teams conduct regular health assessments of habituated family groups, collecting non-invasive samples and conducting observational health checks during supervised visits. Habituation itself, the multi-year process through which gorillas are acclimatised to human presence to the point where trekking is safe and non-disruptive, generates a detailed behavioural record for each family group. This record allows veterinarians and behavioural researchers to detect anomalies: a group that is ranging more widely than normal may be responding to food shortage in its usual range; a silverback that is more agitated during visits may be under pressure from a neighbouring group or from habitat disturbance at the edge of its range.
Respiratory diseases, to which gorillas are vulnerable given their genetic proximity to humans, are among the most carefully tracked health indicators. The mandatory mask requirement for trekking visitors — masks must be worn when within seven metres of gorillas — and the group size limit of eight people per visit per family group are management responses to the disease transmission risk. Outbreaks within family groups are recorded and contribute to the longitudinal health database that informs habitat management decisions.
[QUOTE: local guide on the moment you realise how close you are to a family that has genuinely habituated to human presence]
Reading the Metrics Together: What the Data Signals for Bwindi
Taken individually, each metric — census count, vegetation index, corridor integrity score, conflict incident rate, health indicator — provides a partial picture. Taken together, they describe the condition of a habitat system under real but so far manageable pressure. Bwindi's gorilla population has grown during a period of increasing human population in surrounding areas, increasing tourism infrastructure development in the wider western Uganda landscape, and documented corridor disturbance between major forest blocks. The combination of population growth and external pressure means that the metrics currently indicate a habitat that is performing well within its gazetted boundary while facing unresolved challenges at its edges and in the broader landscape.
The forest's ecological history reinforces this reading. Bwindi is one of the few African forests to have persisted as a refugium through the last Ice Age, maintaining continuous forest cover for more than 25,000 years. This antiquity means that the plant communities, soil systems, and hydrological functions of the forest are not easily replicated elsewhere. A habitat metric that captures only the current state — today's canopy cover, today's gorilla count — misses this historical dimension. Conservation planning for Bwindi therefore incorporates the irreversibility of any loss: degradation that could be reversed in a young secondary forest may be effectively permanent in a forest of this age and composition.
Bwindi and Echuya Central Forest Reserve are also jointly identified as the primary stronghold for an endangered wild cat species on the Uganda Red List. This co-occurrence of multiple threatened species at the same sites is itself a metric — it indicates that the habitat conditions which support mountain gorillas also support other species at risk. The overlap between gorilla range and the range of other Red List species is not accidental; it reflects the exceptional ecological richness of the Albertine Rift montane zone. Protecting gorilla habitat in Bwindi therefore delivers conservation benefits for a much wider range of species than the census numbers alone suggest.
What the data from more than a decade of continuous monitoring in Bwindi tells us is that targeted, sustained, multi-metric conservation — combining population census, habitat assessment, health monitoring, and community engagement — can produce positive outcomes even under significant external pressure. The gorilla population that encountered our trekking group in June 2026, calm and unhurried on a forest slope, exists because those metrics have guided management decisions that have worked. Whether they continue to work depends on whether the monitoring continues, the data is honestly interpreted, and the management responses remain proportionate to what the indicators are showing.