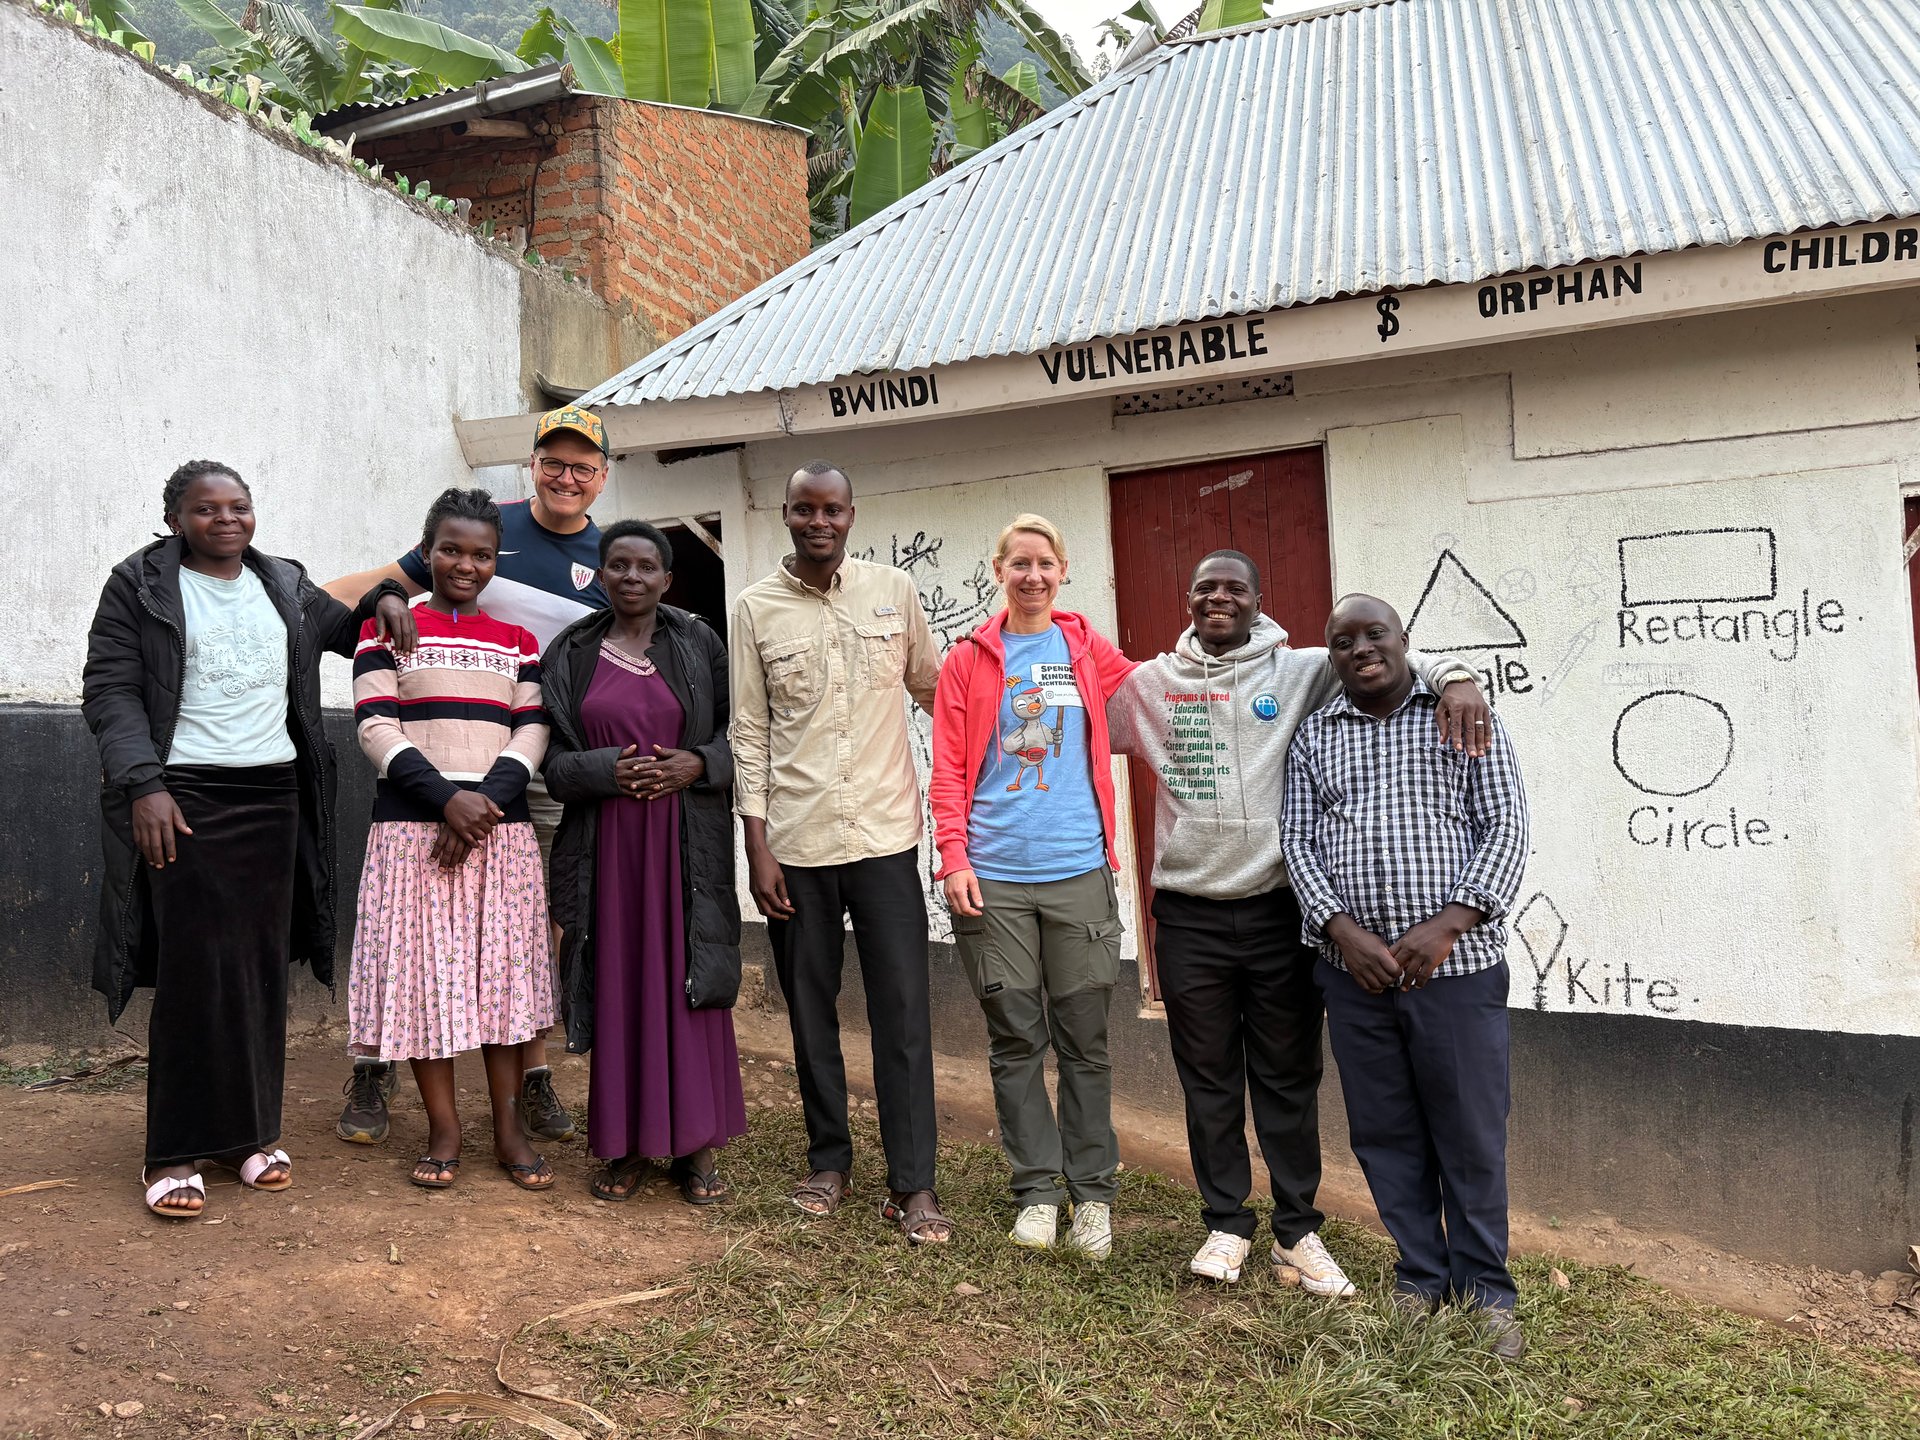
On the roadside in Buhoma, during my visit in January 2026, we came across a boy of around ten years old sitting on a pile of stones. He was working methodically, striking rocks with a metal tool to break them into gravel suitable for house foundations. The stones he produced would be sold as building material, contributing to his family's income. It is, as the locals will tell you, ordinary work — adults do it too. Children participating in family livelihood activities is a normal part of daily life in rural communities across this part of Uganda. What struck me was not the work itself but how clearly it illustrated the gap between what gets measured in formal monitoring frameworks and what life actually looks like on the ground.
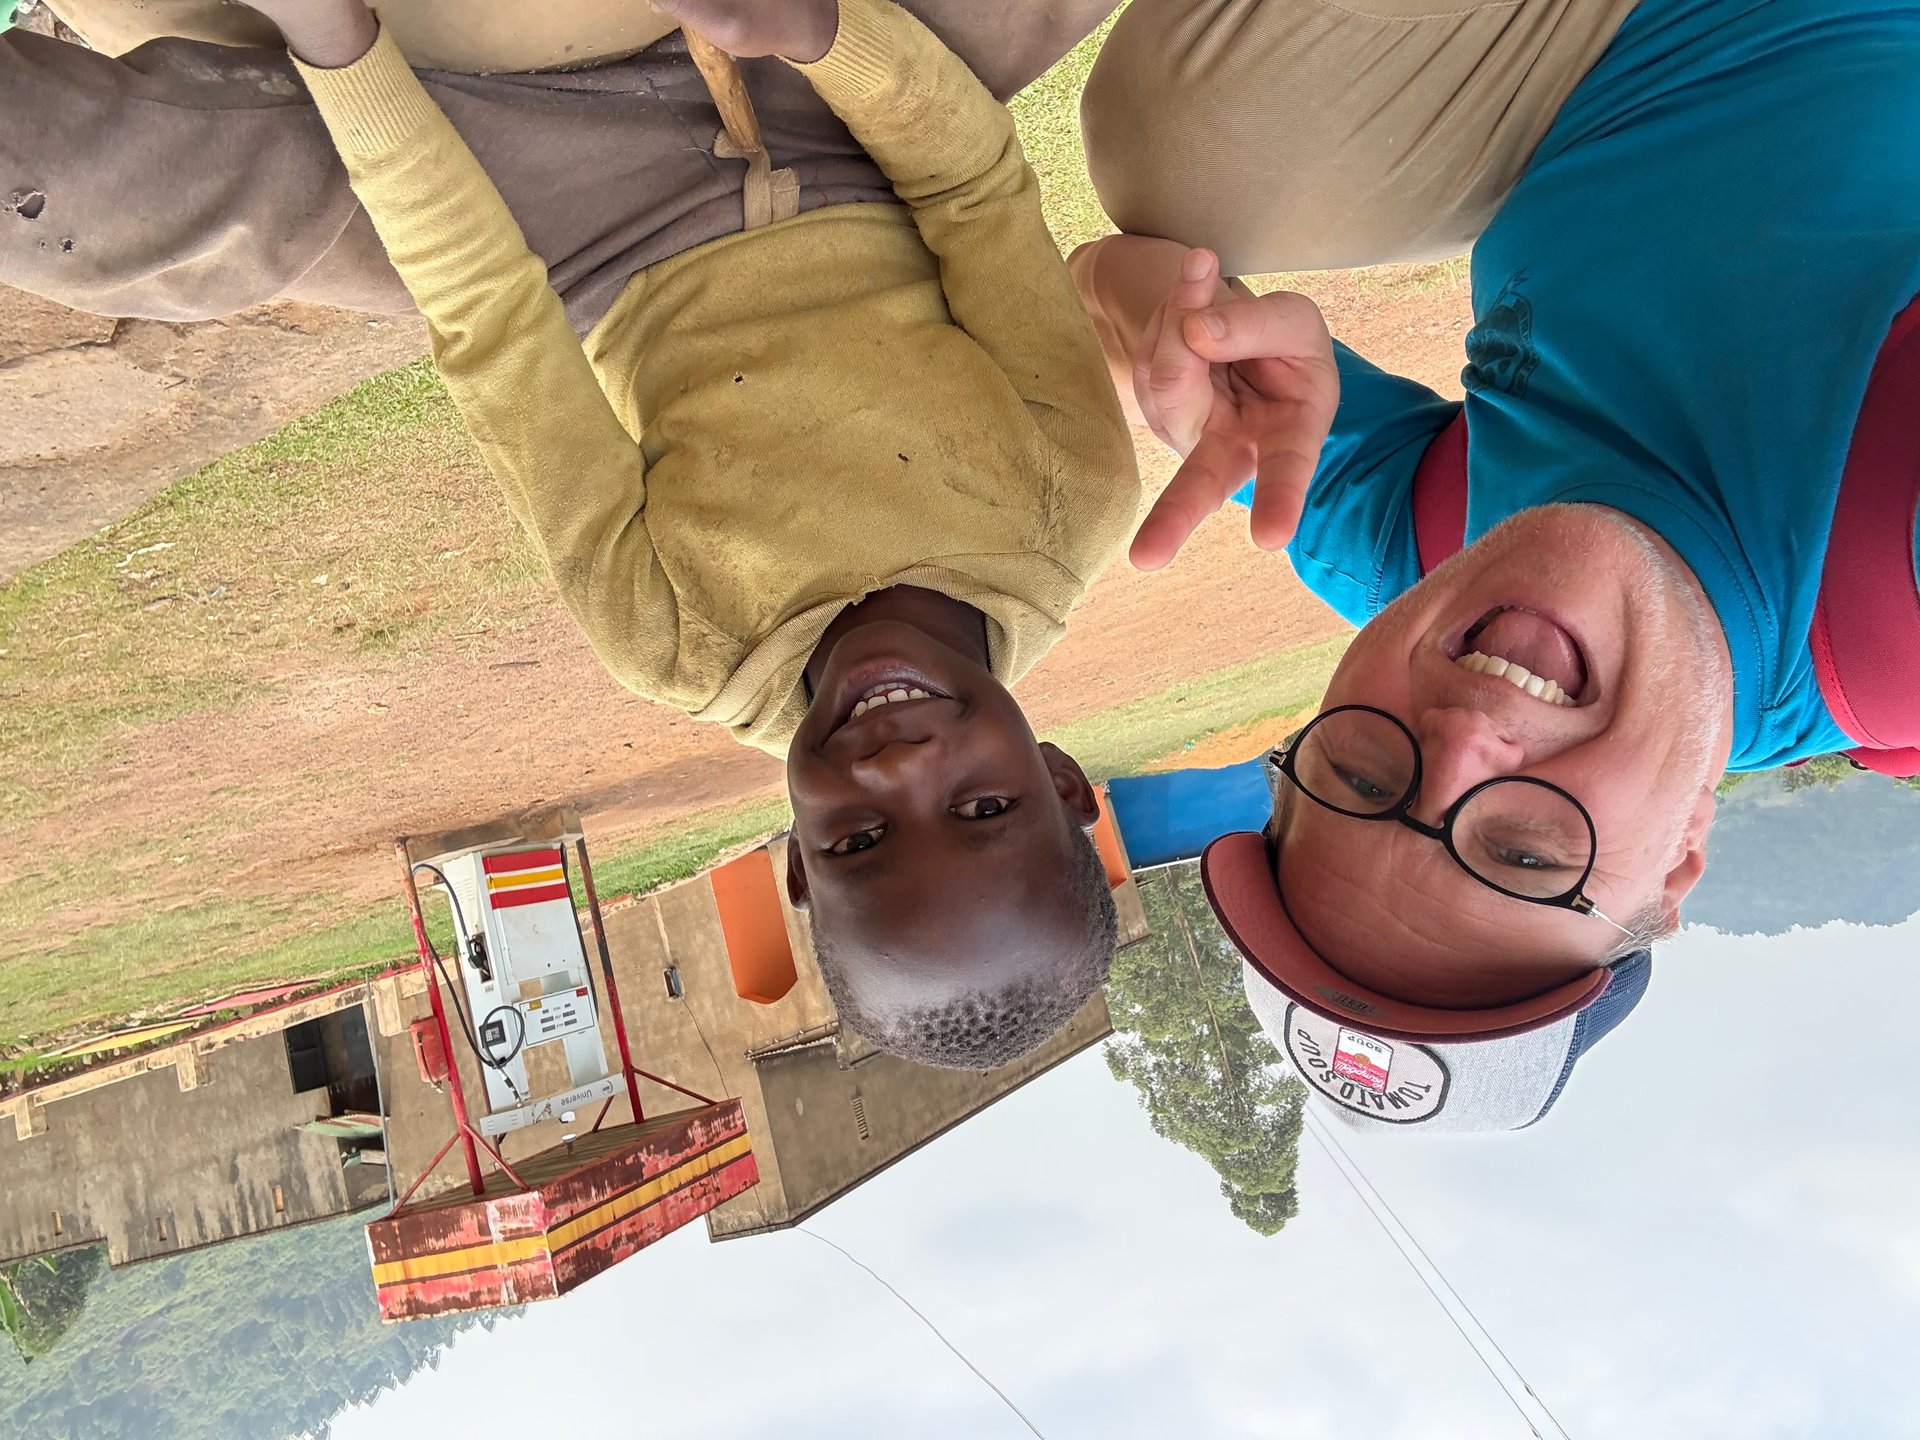
The boy was cheerful. He looked up, grinned, and went back to work with the easy confidence of someone who has been doing this for a while. He did not appear to be in distress, and the task had a clear economic logic behind it. But that kind of informal livelihood contribution — stone breaking, carrying water, tending animals, working in fields alongside parents — is not the kind of activity that appears in the standardised monitoring tables that district planning offices use to track community welfare. Understanding what livelihood monitoring in the Bwindi Impenetrable National Park region actually captures — and what it misses — matters for anyone trying to understand how communities here are doing, and how that relates to the conservation of the forest.
Across multiple visits to Buhoma between October 2024 and July 2026 — totalling more than fifty days of documented time in and around the park boundary — I have had the opportunity to see this monitoring question from both the community side and the institutional side. The gap between them is instructive.
What Livelihood Monitoring Means in the Bwindi Context
Livelihood monitoring in the communities around Bwindi National Park is not a single coordinated system. It is a layered set of data collection processes operated by different entities at different levels, with overlapping but not always consistent coverage. At the broadest level, the Uganda Bureau of Statistics runs national household surveys — the Uganda National Household Survey, conducted periodically — that provide statistical snapshots of income, food security, access to services, and employment for the whole country, including Kanungu and Kisoro Districts where most of the Bwindi boundary communities are located.
Below the national level, district local governments are responsible for development planning and monitoring within their boundaries. Kanungu District, which covers the Buhoma and Rushaga sectors of Bwindi, and Kisoro District, which covers the Nkuringo area, each maintain planning departments that are in principle responsible for tracking progress against the District Development Plan indicators. These indicators typically include measures of agricultural productivity, household income levels, access to clean water, school enrolment, and health service utilisation. Progress against those indicators is supposed to be reported up through the District Development Committees to the Ministry of Local Government, which has data-sharing arrangements with the Uganda Bureau of Statistics and other national bodies.
The practical reality is that district-level monitoring capacity varies considerably across Uganda. Rural districts in the south-west, while covering areas of high ecological significance, are not among the better-resourced local government units in the country. Staffing in planning, monitoring, and enforcement functions is often below the levels required for comprehensive data collection, as documented in national assessments of institutional capacity gaps across Uganda's local government system.
The Administrative Structure Behind Monitoring
The formal monitoring architecture in the Bwindi region runs from households up through parish councils, sub-county councils, and district councils to the national level. Parish councils are the lowest tier in this structure that carries formal responsibility for development monitoring. Each parish — a unit of a few thousand people in rural Uganda — has an elected council that includes a development committee. That committee is meant to identify community needs, oversee the implementation of small development projects funded through government transfers, and report back to the sub-county on what has been achieved.
Parish councils in the Bwindi area are part of the administrative units in Kanungu and Kisoro Districts. Their monitoring responsibility covers what happens at the most granular level of community life: whether a school latrine funded by a government transfer was actually built, whether a water point is functioning, whether a community savings group has maintained its membership. Project Management Committees — formed when a specific programme or capital project is being implemented — operate alongside this permanent parish structure to track the specific outputs of discrete investments.
At the district level, the District Technical Planning Committee coordinates across sector departments — health, education, agriculture, natural resources — to produce the consolidated monitoring and evaluation reports that feed into the District Development Plan review process. The MTPC (Monitoring and Technical Planning Committee) supports M&E activities related to the Local Government Development Programme, which has been the main vehicle for channelling central government development resources to districts across Uganda. This is the institutional machinery through which livelihood data from communities around Bwindi is supposed to flow upward and inform planning decisions.
Uganda Wildlife Authority intersects with this local government monitoring structure primarily through the community revenue-sharing programme. UWA returns a percentage of park gate fees to parishes adjacent to Bwindi, and the use of those funds is monitored through a joint process involving UWA, the district, and the receiving communities. Projects funded through revenue sharing — classroom blocks, boreholes, health post improvements — are tracked in the UWA community benefit records, which provide a separate data set on a specific subset of livelihood-relevant infrastructure. The broader coordination between UWA and local governments in the Bwindi area is covered in detail on the UWA and Community Governance page.
What Gets Measured: Key Livelihood Indicators
The indicators that appear in formal monitoring reports for communities around Bwindi tend to be the ones that are easiest to count. Agricultural output — acreage under cultivation, crop yields for key staples like beans and maize, number of livestock households — shows up in district agricultural department figures. School enrolment and attendance rates come from education department records. Health facility utilisation data comes from health management information systems. These are the hard numbers that feed into District Development Plan reviews.
Income source diversification is a more complex indicator, but it matters enormously for communities living alongside a national park. A household that derives income from multiple activities — tourism employment, craft sales, agricultural production, casual labour — is more resilient to shocks than one that depends on a single livelihood source. In communities around Bwindi, tourism employment is a significant income stream for a segment of the population. Guides, porters, lodge staff, and the informal economy around visitor services — the boda-boda drivers, the small shops, the craft sellers — all depend on the steady flow of visitors to the park.
The craft economy in particular represents a livelihood that is both locally rooted and directly connected to the conservation economy. When I visited community craft groups in and around Buhoma in January and June 2026, I saw production that ranged from woven baskets and jewellery to carved wooden items and printed fabric. These are sold directly to tourists at park entry points and in Buhoma village, and through intermediary organisations that export to Kampala and international buyers. The income generated is real, though it is difficult to capture precisely in standard monitoring frameworks because much of it is informal and seasonal. The crafts and tourism economy at Bwindi is a significant part of the livelihood picture that monitoring systems are still catching up with.
Subsistence activities also feature prominently in the real livelihood picture. Households grow food, raise poultry, and in some cases keep larger livestock. During a visit to a poultry project in Buhoma in June 2026, I documented the beginning of a small chicken-rearing scheme at a community orphanage: the first birds were purchased from a local farmer, and the plan was for the flock to provide both eggs for household consumption and surplus stock for sale. This kind of micro-level livelihood diversification — a few chickens, a small vegetable plot, the sale of gravel from stone breaking — is the texture of economic life in communities that the broader monitoring numbers struggle to represent.
Livelihood Monitoring Around Bwindi: Key Facts
Districts
Kanungu and Kisoro Districts administer the communities adjacent to Bwindi Impenetrable National Park. Their planning departments are the primary local government bodies responsible for livelihood monitoring and development planning.
Forest Extraction Pressure
Between 2020 and 2025, Bwindi recorded 20 to 60 non-timber forest product extraction incidents per year, according to the State of Wildlife Resources in Uganda 2026. Livelihood monitoring data informs where targeted support can reduce this pressure.
Monitoring Structure
Parish councils feed data up through sub-county and district councils to the Ministry of Local Government. Project Management Committees and District Technical Planning Committees coordinate sector-specific monitoring at the district level.
Conservation Status
Bwindi and Echuya are classified as critical habitat for an endangered cat species on Uganda's Red List, according to the State of Wildlife Resources in Uganda 2026. Community livelihood stability directly affects pressure on this habitat.
How Monitoring Data Feeds Into Conservation Planning
The connection between livelihood monitoring and conservation is not theoretical in the Bwindi context. The park management plans that Uganda Wildlife Authority develops for Bwindi Impenetrable National Park are explicitly informed by the socio-economic context of boundary communities. The rationale is straightforward: communities that face acute livelihood pressure have stronger incentives to extract resources from the forest. Monitoring that tracks whether communities have adequate alternative income sources, food security, and access to basic services is therefore directly relevant to predicting where boundary pressure is likely to be highest and where conservation investment in community support will have the greatest impact.
NatureUganda, which has operated bird monitoring programmes in the Bwindi region as part of broader conservation monitoring activity, works within a community context in which the relationship between forest condition and community welfare is well understood by local partners. Organisations like this depend on the availability of local staff and community cooperators who have stable enough livelihoods to participate consistently in monitoring work. The practical capacity for conservation monitoring in the field is therefore itself a function of community livelihood stability — an important but rarely made explicit connection.
The conservation monitoring system at Bwindi tracks forest condition, wildlife population trends, and boundary incidents. The community livelihood monitoring conducted by district local governments runs in parallel but not always in coordination with this conservation monitoring. Where the two systems do interact is in the community benefit-sharing reviews, where UWA and district representatives jointly assess what community needs are, where revenue-sharing investment has made a difference, and where gaps remain. That intersection is where livelihood data most directly shapes conservation decisions.
Forest resource extraction data from the park is a concrete example. Non-timber forest product incidents at Bwindi — ranging from firewood collection to the gathering of medicinal plants and building materials — recorded between 20 and 60 incidents annually between 2020 and 2025, according to the State of Wildlife Resources in Uganda 2026. This figure, low by some measures but meaningful given the biodiversity sensitivity of the forest, is taken seriously by park management as a signal of boundary pressure. When community livelihood monitoring data shows that alternative income sources are weakening — a drought affecting agricultural output, a decline in tourism arrivals reducing employment — it provides advance warning of conditions likely to increase that extraction pressure. The system is imperfect, but the logic connecting the two data streams is sound.
The Gap Between Monitoring Data and Ground Reality
The most important thing to understand about livelihood monitoring in the Bwindi area is the distance between what the monitoring system describes and what life looks like on the ground. The ten-year-old boy breaking stones by the roadside in Buhoma will not appear in any district monitoring table. His contribution to household income is real — the gravel he produces is purchased and used — but it belongs to the informal economy that household surveys can only partially capture and that routine administrative monitoring does not attempt to capture at all.
This gap is not unique to the Bwindi region. It is a structural feature of monitoring systems across Uganda and across much of sub-Saharan Africa, where a large proportion of economic activity takes place outside formal employment and formal markets. The Uganda National Household Survey, which covers socio-economic, labour force, and community modules, attempts to address this through a comprehensive household-level enumeration that goes beyond what administrative records can capture. But it is conducted periodically rather than continuously, and the time between surveys is long enough for significant changes in community circumstances to go undocumented.
On the ground in Buhoma, what you see is a community that is economically diverse in ways that formal metrics tend to flatten. There are households with members employed full-time in park tourism — guides, rangers, lodge staff — and households that depend entirely on subsistence agriculture. There are women running small shops with solar panels on the roof and basic mobile money infrastructure, and there are children supplementing family income through informal work. There are community organisations running savings groups, poultry projects, and craft cooperatives, and there are individual households that have no connection to any formal programme or institutional structure.
[QUOTE: local community member or development worker in Buhoma on the difference between what gets reported and what the community actually experiences day to day]
The monitoring systems that exist — district development monitoring, UWA benefit-sharing reviews, national household surveys — are not useless. They provide a framework for tracking trends over time, for identifying where investment has made a measurable difference, and for making the case to central government and external partners that resources directed to boundary communities have produced results. But the granular, intimate knowledge of how families in Buhoma are actually managing their livelihoods — which is what would be needed to make really precise predictions about boundary pressure on the forest — lives in the community itself, not in the monitoring tables.
What the monitoring gap points to is a case for sustained community presence. The most reliable picture of livelihood conditions in communities around Bwindi comes not from any single data system but from the accumulated knowledge of people who have been there — staff of community organisations, local government extension workers, lodge operators who hire locally, and visitors who spend long enough in Buhoma to see past the tourist-facing surface. That is what eighteen documented visits, more than fifty days of GPS-tagged time in and around the park, and hundreds of community photographs taken over two years actually produce: a picture of livelihood reality that no quarterly monitoring report can fully replicate.